ESP-Wroom-02とRaspberry-Piを使った室内温度・湿度データ収集システムについて紹介します。
システム概要
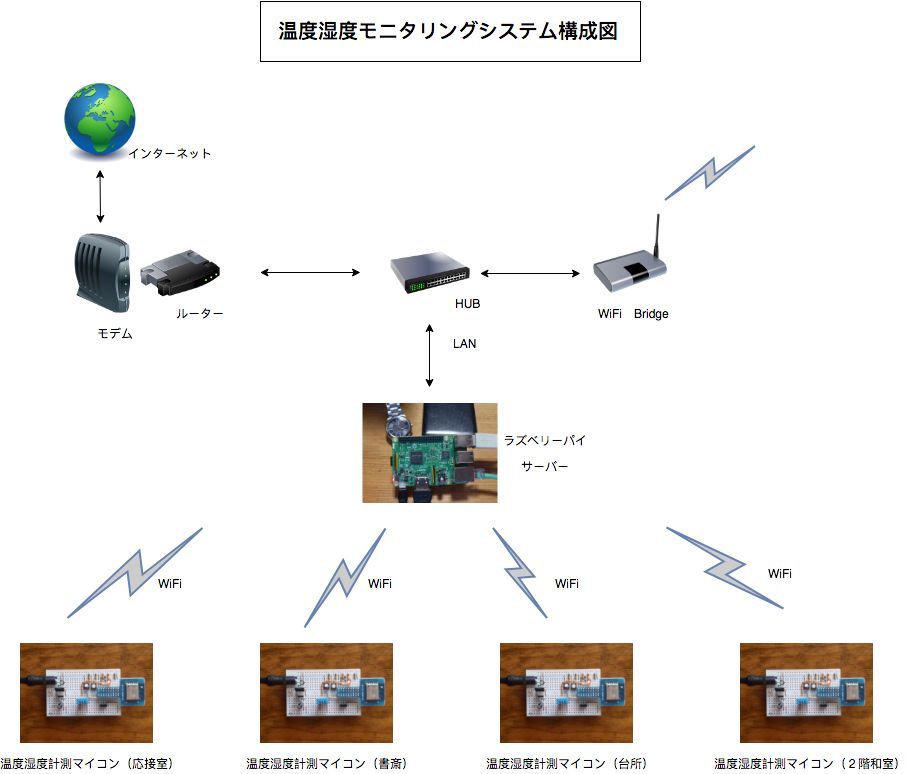
温度湿度モニタリングシステムは、温度湿度を計測するマイコンとデータ収集を行うサーバーコンピュータからなり、WiFi通信により接続されている。
サーバーに保存されたデータは自宅内LAN経由でのデータ表示の他、インターネット経由で外出先からも見ることが出来る。
温度湿度計測マイコン
温度湿度計測マイコンは、ESP-Wroom-02(WiFi通信機能をもつ32ビットマイコン)に温度、湿度センサー(DHT11)を繋ぎ、一定周期(例えば毎分毎)でデータを計測し、サーバーへ送信している。
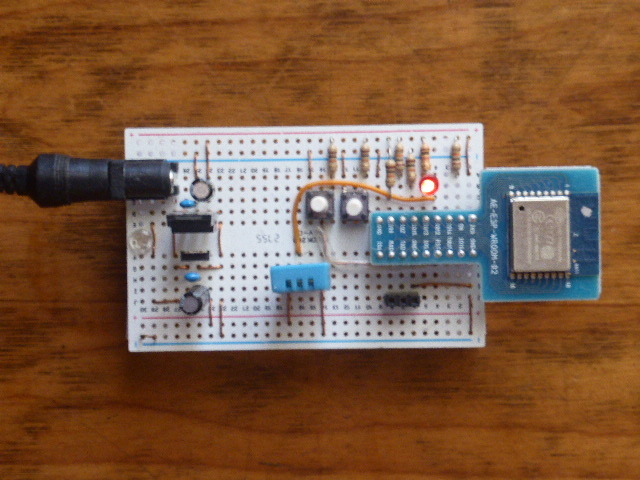
右のT字型の基盤に載っているマイコンがESP-Wroom-02で、白い基盤の中央下にあるのが温度湿度センサーDHT11 。
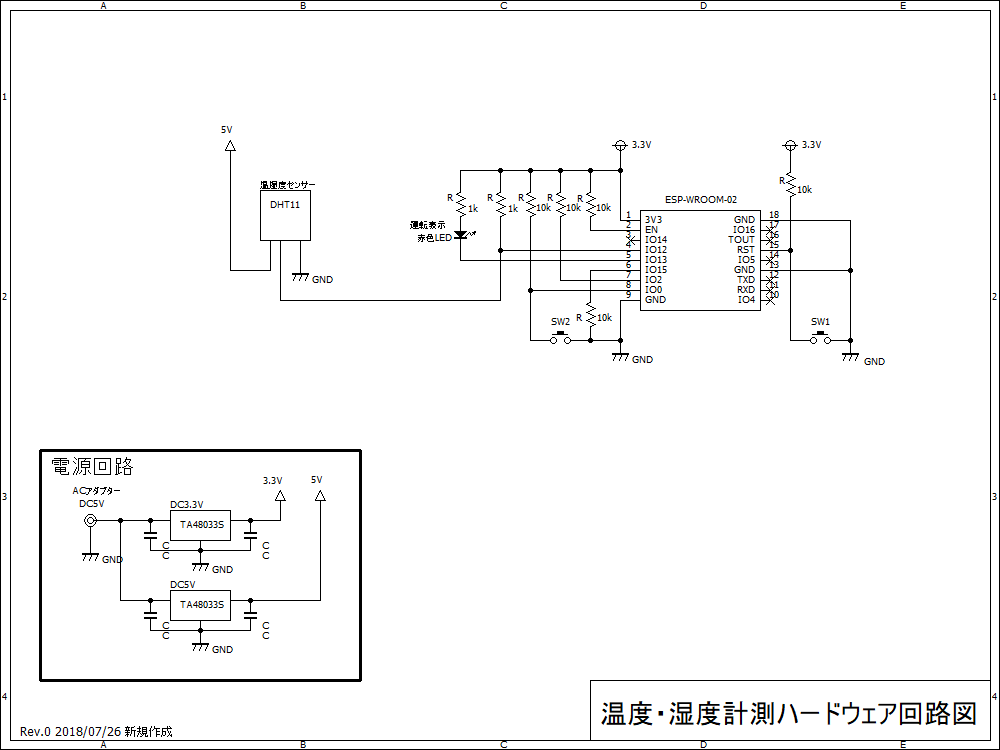
温度湿度計測マイコン回路図
ESP-Wroom-02プログラム
マイコンESP-Wroom-02のプログラム開発は、Arduinoソフトウェア開発環境を使用した。ESP-Wroom-02のソフトウェア開発にはこのSDKツールを使うのが一般的で、技術情報も多い。
プログラムリストを下記に示す
<pre class="C">/*
 応接室…  TD101、HD101
 書斎…TD202、HD202(別プログラム)
 台所…TD303、HD303、 IN103(別プログラム)
 2F和室・・・TD404、HD404

 */
 define PROG_NAME "(TempHumid_1)"
 include <Ticker.h>
 include <ESP8266WiFi.h>
 include "DHT.h"
 define DHTPIN 12
 define DHTTYPE DHT11   // DHT 11
 define LED_BLINK 13
 DHT dht(DHTPIN, DHTTYPE);
 define TAG1 TD101
 define TAG2 HD101
 Ticker ticker1;
 const char* ssid = "SSID";
 const char* password = "パスワード";
 const char* host = "192.168.0.100";
 static int count_sec = 10;  // 60 sec counter
 void count_down() {
   --count_sec;
   digitalWrite(LED_BLINK, count_sec%2);
 }
 void setup() {
   Serial.begin(115200);
   delay(10);
 ticker1.attach_ms(1000, count_down);
   pinMode(LED_BLINK, OUTPUT);
   Serial.println("DHT11 init");
   dht.begin();
 // We start by connecting to a WiFi network
   Serial.println();
   Serial.println();
   Serial.print("Connecting to ");
   Serial.println(ssid);
   WiFi.mode(WIFI_STA);
 //  WiFi.PrintDiag(Serial);
 WiFi.begin(ssid, password);
 while (WiFi.status() != WL_CONNECTED) {
     delay(500);
     Serial.print(".");
   }
   Serial.println("");
   Serial.println("WiFi connected");
   Serial.println("IP address: ");
   Serial.println(WiFi.localIP());
 }
 // int value = 0;
 void loop() {
 if( count_sec<=0 ){
 Serial.print("connecting to ");
   Serial.println(host);
 float h = dht.readHumidity();
   float t = dht.readTemperature();
 /*  Serial.print("Humidity: ");
   Serial.print(h);
   Serial.print(" %\t");
   Serial.print("Temperature: ");
   Serial.print(t);
   Serial.print(" C ");/
 // Use WiFiClient class to create TCP connections
   WiFiClient client;
   const int httpPort = 80;
   if (!client.connect(host, httpPort)) {
     Serial.println("connection failed");
     return;
   }
 // We now create a URI for the request
   String url = "/roomenvr/rcv_data2.php";
   url += "?HD101=";
   url += h;
   url += "&TD101=";
   url += t;
 Serial.print("Requesting URL: ");
   Serial.println(url);
 // This will send the request to the server
   client.print(String("GET ") + url + " HTTP/1.1\r\n" +
                "Host: " + host + "\r\n" +
                "Connection: close\r\n\r\n");
   unsigned long timeout = millis();
   while (client.available() == 0) {
 if (millis() - timeout> 5000) {
 Serial.println(">>> Client Timeout !");
       client.stop();
       return;
     }
   }
 // Read all the lines of the reply from server and print them to Serial
   while(client.available()){
     String line = client.readStringUntil('\r');
     char str_time[5];
 char *p; p = strstr(&line[0], ":Data Inserted"); Serial.print(line); if(p){   memset(str_time, 0, 5);   strncpy(&str_time[0], p-2, 2);   count_sec = 61 - atoi(str_time);    Serial.print("timer set:");   Serial.println( count_sec); }
 }
 Serial.println();
   Serial.println("closing connection");
   }
 }</pre>
サーバー
サーバーはラズベリーパイ(Raspberry-Pi:低価格64ビットコンピュータ)で構築、自宅内LANに接続して、温度湿度計測マイコンから送られてくる刻々のデータをデータベースに保存している。
保存されたデータは、自宅内LANからの要求によりWEB表示することが出来る。また、データはVPN経由で自宅内LANに入ることで、自宅外から見ることも出来る。
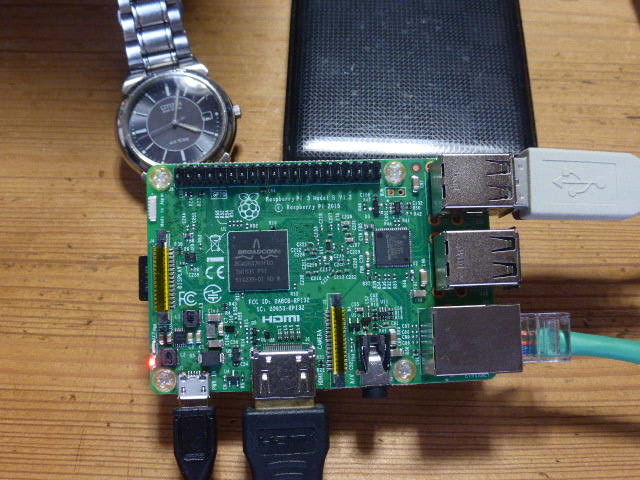
自宅サーバーとして運用のラズベリーパイ
データ受信プログラム
サーバーのプログラムには、温度湿度計測マイコンから送られるデータを受信するプログラムとデータ表示のためのWEBサービスプログラムがある。
プログラムとしては、ともにphp言語を使用。
// date_default_timezone_set('Asia/Tokyo');
$dt = date("Y/m/d H:i:s"); // "2015/03/10 06:00:00"
$hmd = $_GET['humid'];
$tmp = $_GET['temp'];
$db = new SQLite3('room_envr.db');
if(!$db){
echo $db->lastErrorMsg();
}
$tm=substr($dt, 17, 1);	//  0123/56/89 12:45:78
if( $tm == "0" ){
$results = $db->query("SELECT max(rowid), * FROM data_log");
$row = $results->fetchArray(SQLITE3_ASSOC);
$dtp = $row['datetime'];
if( substr($dt, 15, 1) != substr($dtp, 15, 1) ){
//			$query=sprintf("UPDATE latest_data set datetime='%s', humidity='%s', temperature='%s'", $dt,$hmd,$tmp);
//			$db->exec($query);
$db->exec("INSERT INTO data_log (datetime,humidity,temperature) VALUES ('$dt', '$hmd', '$tmp') ");
echo "Data Inserted in LogFile\n";
}
}
$db->close();
WEBサービスプログラム
WEBサービスプログラムは、WEBサイトからの要求で起動するプログラムであり、”index.php”のファイル名として作成保存されている。
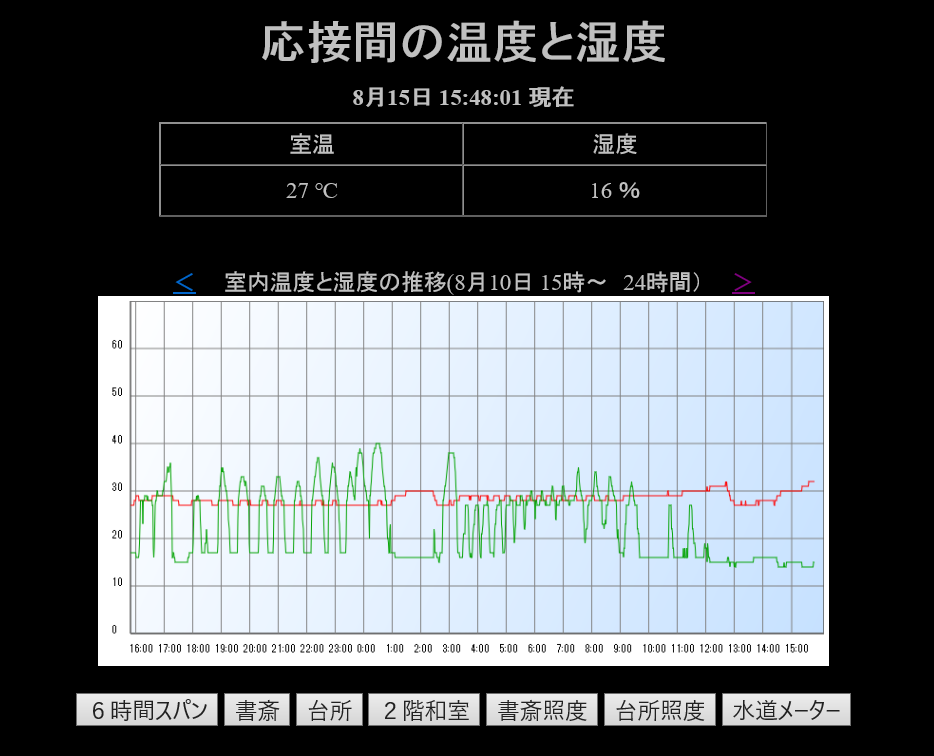
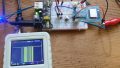
表示される画面は、1分毎に記録された温度および湿度が下図のようなグラフで表示される。横スパンは6時間、24時間に切換え可能である。
WEBサービスプログラムを下記に示す。
<!DOCTYPE html PUBLIC "-//W3C//DTD XHTML 1.0 Transitional//EN" "http://www.w3.org/TR/xhtml1/DTD/xhtml1-transitional.dtd">
<html xmlns="http://www.w3.org/1999/xhtml">
<head>
<meta content="ja" http-equiv="Content-Language" />
<meta content="text/html; charset=utf-8" http-equiv="Content-Type" />
<meta http-equiv="refresh" content="60">
<meta name="robots" content="noindex,nofollow">
<link rel="stylesheet" href="style.css" type="text/css" />
<script src="c_graph.js" type="text/javascript"></script>
<script type="text/javascript">
<?php
$dt = date("Y/m/d H:i:s"); // "2015/03/10 06:00:00"
// if( count($_GET) != 0){
if(isset($_GET['room'])){
$room = $_GET['room'];
}else{
$room = 1;
}
if(isset($_GET['span'])){
$span = $_GET['span'];
}else{
$span = 6;
}
if(isset($_GET['tmz'])){
$tmz = $_GET['tmz'];
}else{
$tmz = 0;
}
if($span == 6){
$spanS = "graph1.scaleX = 2;";
}else{
$spanS = "graph1.scaleX = 0.5;";
}
$db = new SQLite3('room_envr.db');
// 最新データをdata_statusから取出す
/* $results = $db->query("SELECT max(rowid), * FROM data_log2" );
// $results = $db->query("SELECT * FROM data_log2 ORDER BY rowid DESC LIMIT 2 " );
$row = $results->fetchArray(SQLITE3_ASSOC);
$dt = $row['datetime'];
*/
/*
$dt = $row['datetime'];
// $i=0;
while( ($row = $results->fetchArray(SQLITE3_ASSOC)) ){
// echo "tagname", $row['tagname'],"=",$row['value1'];
$dt = $row['datetime'];
if($row['tagname'] == "TD101"){
$tmp = $row['value1'];
}else if($row['tagname'] == "HD101") {
$hmd = $row['value1'];
}
// $i = $i + 1;
// echo $i;
}*/
// $row = $results->fetchArray(SQLITE3_ASSOC);
// $dt = $row['datetime'];
//グラフ作成
// $graph = array(array(),array(0,1,2));
// $dtp = strtr($dt, "/", "-");
$dts= strval( $span * ($tmz-1));
$dte= strval( $span * ($tmz));
$dts = date('Y/m/d H:i:s', strtotime($dt .$dts." hours"));
// $dts = date('Y/m/d H:i:s', strtotime($dt ."-10 minutes"));
$dte = date('Y/m/d H:i:s', strtotime($dt .$dte." hours"));
$query=sprintf("SELECT * FROM data_log2 where (datetime>='%s') and (datetime<='%s') and ((tagname = 'TD10%d') or (tagname = 'HD10%d'))", $dts, $dte, $room, $room);
$results = $db->query($query);
// echo $query;
$i=0;
$xa="";
$y1="";
$y2="";
while( ($row = $results->fetchArray(SQLITE3_ASSOC)) ){
$dtp= date('G:i', strtotime($row['datetime']));
// echo " datetime: ",$dtp,"tagname: ", $row['tagname'],"=",$row['value1'];
if($row['tagname'] == "TD10".$room ) {
$xa .= "'".$dtp."'".",";
$y1 .= strval($row['value1']).",";
}else if($row['tagname'] == "HD10".$room ) {
$y2 .= strval($row['value1']).",";
}
$i = $i + 1;
}
$imax = $i;
// 最新データをdata_statusから取出す
// $results = $db->query("SELECT max(rowid), * FROM data_log2" );
// $results = $db->query("SELECT * FROM data_log2 where (tagname = 'TD101') or (tagname = 'HD101') ORDER BY rowid DESC LIMIT 2 " );
$query=sprintf("SELECT * FROM data_log2 where (tagname = 'TD10%d') or (tagname = 'HD10%d') ORDER BY rowid DESC LIMIT 2", $room, $room);
$results = $db->query($query);
while( ($row = $results->fetchArray(SQLITE3_ASSOC)) ){
$dt = $row['datetime'];
if($row['tagname'] == "TD10".$room ) {
$tmp = $row['value1'];
}else if($row['tagname'] == "HD10".$room ) {
$hmd = $row['value1'];
}
}
$db->close();
?>
<!--
window.onload = function(){
draw();
}
function draw()
{
//グラフの値
<?php echo "var points1 = [" . $y1 . "];\n"; // 1,3,4,6.75,2,3,12,1,10.5,4,3,14,5,6,8,12,11,9,3];
echo "var points2 = [" . $y2 . "];\n"; // 0,2,4,4,6,1,4,5,6,3,1,2,3,22,35,44.4,20.5,10];
// var points3 = ["10,8,4,2,7,11,18,15,16,17,22,22,17,8,15,19,32,30,34];
?>
<?php echo "var label0 = [" . $xa . "];\n";
?>
//グラフ1(上)
var graph1 = new c_graph("canvas1"); //インスタンス (引数:対象キャンバスのid属性)
//-------------------以下は任意のパラメータ
<?php echo $spanS,"\n"; ?>
graph1.scaleY = 5; // デフォルトは10
graph1.startX = 30; //グラフの描画開始位置(左下を0とする) デフォルトは30
graph1.startY = 30; // デフォルトは30
graph1.memInterval = 50; // 60 Y軸のメモリ間隔(スケール相対)デフォルトは50
graph1.gridX = false; //縦のグリッドを表示するか否か デフォルトはtrue
graph1.gridY = true; //横のグリッドを表示するか否か デフォルトはtrue
graph1.dataDisp = false; //グラフの点に値を表示するか否か デフォルトはtrue
//-------------------パラメータ設定ここまで
graph1.reset(label0, <?php if($span==6){echo '"30"';}else{echo '"00"';} ?>); //初期化(グラフを消去し、軸を再描画)
graph1.draw(points1,"rgb(255,0,0)"); //グラフを追加 (引数:値配列, 描画スタイル)
graph1.draw(points2,"rgb(0,162,0)");
// graph1.axis(points0,"rgb(0,0,0)");
// graph1.draw(points3,"rgb(0,0,0)");
//グラフ2(下)
// var graph2_1 = new c_graph("canvas2_1");
// var graph2_2 = new c_graph("canvas2_2");
// graph2_1.scaleY = 5;
// graph2_2.startX = 0;
// graph2_2.scaleY = 5;
// graph2_2.dataDisp = false;
// graph2_1.reset();
// graph2_2.reset();
// graph2_2.draw(points1,"rgb(255,0,0)");
// graph2_2.draw(points2,"rgb(0,162,0)");
// graph2_2.draw(points3,"rgb(0,0,0)");
}
-->
</script>
<title>室内温度湿度モニター画面</title>
<style type="text/css">
.auto-style3 {
text-align: center;
margin-left: 0px;
margin-right: 8px;
color: #C0C0C0;
}
.auto-style5 {
vertical-align: middle;
color: #C0C0C0;
font-family: "MS Pゴシック";
font-size: large;
}
.auto-style6 {
text-align: center;
font-size: x-large;
}
.auto-style7 {
text-align: center;
margin-top: 25px;
}
.auto-style9 {
text-align: center;
font-size: x-large;
color: #FF0000;
}
</style>
</head>
<body style="color: #c0c0c0; background-color: #000000" class="auto-style9">
<h1 class="auto-style7" style="height: 40px; color: #C0C0C0;"><?php if($room==1) echo "応接間の";else echo "書斎の"; ?>温度と湿度</h1>
<h2 class="auto-style6" style="height: 20px"><?php echo date('n月j日 G:i:s', strtotime($dt)); ?> 現在</h2>
<table align="center" border="1" cellspacing="0" cellpadding="1" style="width: 640px; height: 90px">
<tr>
<td class="auto-style6" width="50%" style="height: 40px; color: #C0C0C0;">室温</td>
<td class="auto-style6" style="height: 40px; color: #C0C0C0;">湿度</td>
</tr>
<tr>
<td class="auto-style6" style="height: 50px"><?php echo $tmp ?> ℃ </td>
<td class="auto-style6" style="height: 50px; color: #C0C0C0;"><?php echo $hmd ?> % </td>
</tr>
</table>
<br />
<br />
<table align="center" cellspacing="0" cellpadding="5" bgcolor="white" ><caption>
<?php
$st ="<a href='index.php?room=".$room."&span=".$span."&tmz=". ($tmz-1)."'><</a>     室内温度と湿度の推移(".date('n月j日 G', strtotime($dts));
echo $st;
$st= "時~ ". $span. "時間)     <a href='index.php?room=".$room."&span=".$span."&tmz=". ($tmz+1)."'>></a></ caption>";
echo $st;
?>
<tr><td>
<canvas id="canvas1" width="760" height="380"></canvas>
</td></tr></table>
<br />
<?php
$st = "<button type='button' class='auto-style6' onclick=\"location.href='./index.php?room=" . $room . "&span=";
if($span==6){
$st .= "24'\">24時間スパン</button> ";
}else{
$st .= "6'\">6時間スパン</button> ";
}
echo $st;
$st = "<button type='button' class='auto-style6' onclick=\"location.href='./index.php?room=" ;
if($room==1){
$st .= "2&span=6'\">1階書斎</button> ";
}else{
$st .= "1&span=6'\">1階応接間</button> ";
}
echo $st;
?>
<button type="button" class="auto-style6" onclick="location.href='../watermeter/index.php?inst=graph'">水道メーター</button>
</body>
</html>